


Course: Introduction to Financial Markets


Course Includes:
-
Price :
£500
£300.00 - Modules : 8
- Video Lessons : 10
- Language : English
- Certifications :No
Share On:
Introduction to the Financial Markets
Getting Started
- Introduction to the Financial Markets
- What are shares?
- What is forex?
- What are Indices?
- What are commodities?
- Interest Rates
- Trading Government bonds
- Charting software (video - How To Use Trading View)
- Spread betting and CFD trading
- What is spread betting?
- What are contract for difference (CFDs)?
- How CFDs differ from spread betting
- What is an order? (videos - How To Work Out Your Risk, How To Place A Trade On MT5)
- Long/Short Positions (video - How To Enter A Long Or Short Position)
- Using stop losses
- How orders are executed
- What is leverage?
- Margin calls
- What is fundamental analysis?
- Why is it used?
- Fundamentals
- Trade examples
- Implementing strategies on the news (advanced)
- Why are newsfeeds and twitter important? (video - How To Check News)
- What is technical analysis?
- Candle sticks
- Support and resistance (video - How To Identify And Uptrend Or Downtrend)
- Breakouts
- How to trade support and resistance (video - How To Identify Support And Resistance)
- Trend and Channels
- Ascending and Descending wedges
- Head and shoulders breakout strategy (advanced) (videos - How To Draw Trend Lines, Breakouts)
- Fibonacci Retracement
- Harmonic Price Patterns (video - Imbalances)
- What is a trading plan?
- How to make a trading plan?
- What is risk management?
- Ways to manage risk
- Controlling emotions that hold you back
- Controlling emotions that entice you to trade
- Controlling emotions that cloud your judgement
- Common trading mistakes
Unlock Your Trading Potential:
Our FX trading course for beginners is meticulously crafted to equip you with the knowledge to begin your trading journey. The course will give you the perfect introduction to the financial markets, while also teaching you the basics of trading from using charting software, setting your trades, trading styles and risk management. The course includes 8 educational modules, 10 videos each teaching a vital trading skill, and a 1 hour bonus webinar on Trading Psychology.
- May Launch Price - £300
£500 - 8 Text based Educational Modules
- 10 Videos - from charting to price patterns
- 1 Hour Trading Psychology Webinar
- Study at your own pace, 24/7
- Access to one of our Trading Mentors
Please see the below snippet from one of the course videos, as well as some example text from one of the modules. For full enrolment to the course please sign up below.
Enroll to the CourseTrend and Channels:
As you'll notice when you look at a chart, market prices do not generally rise or fall in straight lines over a period of time, but rather in a series of zigzags. The pr ice will rise to a peak or a high, then drop to a trough or low. Despite this, the market will usually move in one overall direction or trend, and it's the relative positioning of the peaks and troughs that define this trend.
There are three types of market trend:
Uptrend - For a market to be in an uptrend, each successive peak must be higher than the last, and each trough must also be higher than the preceding one.
Downtrend - For a market to be in a downtrend, there must be a series of successively lower peaks and lower troughs.
Sideways Trend - In a sideways trend there's no clear pattern to the peaks and troughs, with the price generally oscillating in a fairly narrow range between support and resistance levels.
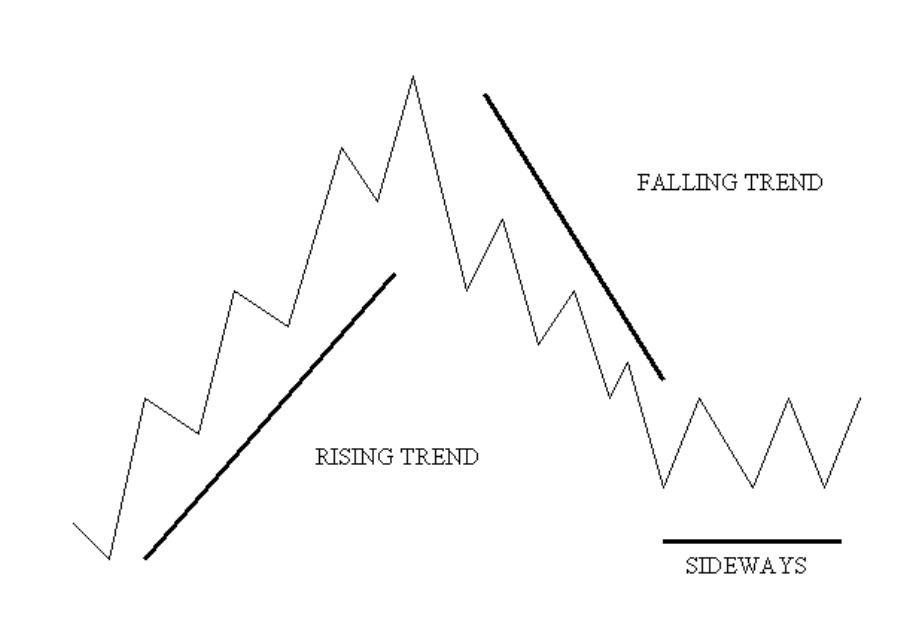
Trends are fairly easy to plot on a chart - all you need to do is connect two major peaks or two major troughs with a line. If you've drawn them correctly, trend lines will often act similarly to support and resistance levels. However, you should note that:
- It only takes two peaks or troughs to draw a trend line, but it takes three to confirm the trend.
- Just like support and resistance levels, the more times the trend line is tested, the stronger it is said to be.
- Steeper trend lines tend to be unreliable and break easily.
For the full trading course, including all educational content, and the 10 educational videos, please enroll here.
Enroll to the Course